

Since the coronavirus pandemic struck in early 2020 there has been a significant increase in volatility and turnover on equity markets across the globe. A narrative that has caught global headlines is the rise and impact of the retail investor and their influence on equity markets. This phenomenon is being observed in all major developed equity markets and Australia is no different.
In May 2020 ASIC released a report titled “Retail investor trading during COVID-19 volatility”. In the report ASIC found the average daily market turnover by retail brokers had increased over 100% while there was a sharp increase (3.4x) in the number of newly opened client accounts associated with retail brokers. The report also found retail investors were trading more frequently as measured by the average time between trades by the same account in a particular stock. In utilising their extensive trade surveillance data ASIC determined that there had been a marked increase in retail investor participation on the ASX[1].
As a collective group, retail investors have traditionally been a large participant in the microcap[2] sector. The microcap sector is dominated by emerging companies that are typically small in size and have relatively low levels of liquidity. These characteristics make it difficult for institutional investors to dominate the trading flow as observed in large cap trading and creates an opportunistic playing field for the retail investor.
If the retail investor is already an active participant in the microcap sector and retail investor activity has taken off, are we able to see any unusual trading activity in the microcap sector here in Australia? The short answer is a definite Yes.
Buy, buy buy, sell, sell, sell!
There has been a notable increase in turnover in the microcap sector since the coronavirus pandemic began in early 2020. The chart below tracks the annual turnover over the microcap sector against the rolling 12 month returns over the past 16 years. Two observations to note (1) a correlation (albeit weak) between liquidity and returns and (2) the explosion in turnover over the past 12 months.
Figure #1 – Annual Liquidity (RHS) vs Microcap Sector 12 month rolling returns (LHS)
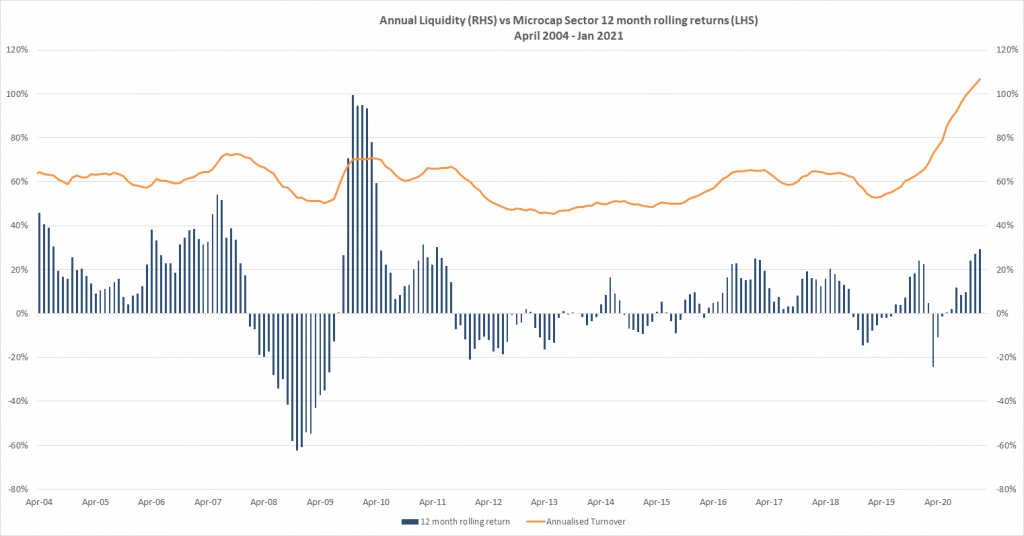
The average monthly turnover of the microcap sector in 2020 was $11.5B (Jan 2020 was $6.3B, September 2020 was $15.3b). This is a 74% increase on the average monthly turnover observed in 2019. January is typically the lowest turnover month due to Australian holidays, so it is noteworthy that turnover in January 2021 was $13.5B, 115% higher than January 2020.
Breaking this down further we looked at the percentage of microcap companies that saw more than 100% of their issued equity turned over in a single quarter. This is the equivalent of a company having every one of its shares on issue traded at least once in a 3-month period. It is not common for a company to see their entire issued capital base turned over in 3 months or less however there are some rational reasons that might explain this behaviour (i.e. a biotech fails a pivotal trial, an explorer drills a series of dud holes, a company is thought to be potentially insolvent or fraudulent etc). In fact, history shows we should expect to see around 1.5% of the sector (by number of companies) turning over its entire share base in a single quarter. As the chart below shows we are now seeing 5% – 7% of companies in the microcap sector having this excessive turnover. A rational conclusion is that shorter term speculative trading behaviour is having an overly large influence on market turnover.
Figure #2: % Microcap stocks turning over at least 100% within the quarter

The next chart examines the same time period as above but shows the percentage of companies in the microcap sector that generate a 100% or greater return at some point in the quarter. Note this analysis compares a company’s price at the start of the quarter with the company’s highest price observed over the quarter (not the closing price at the end of the quarter). If a company’s share price increased 100% or more at some point during the quarter it is counted, even if the quarterly return at the end of the quarter is less than 100%.
Figure #3: % Microcap stocks generating > 100% move intra quarter
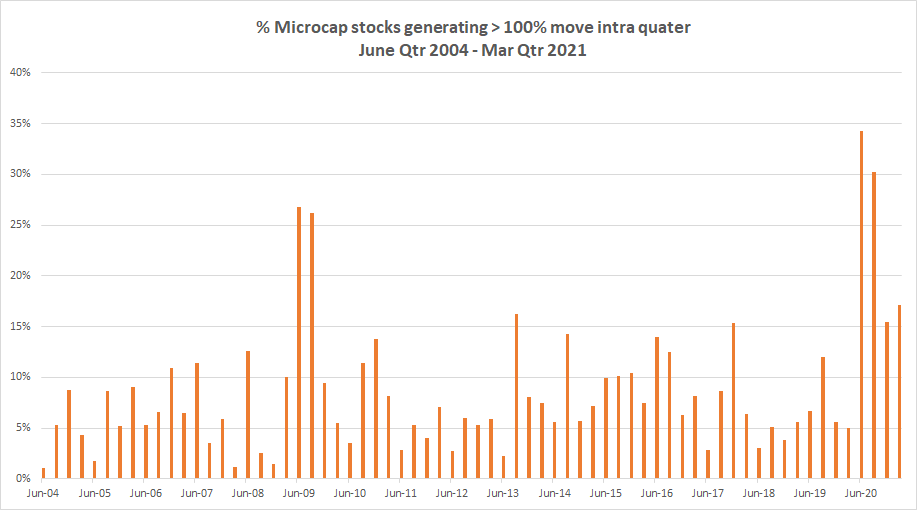
Historically we should expect around 8% of companies in the microcap sector to see a 100% share price move within the quarter. Market conditions at present are seeing double that rate. The June 2020 quarter saw almost 35% of stocks achieve 100% moves – this is understandable as markets recovered from the fastest bear market in history. A similar observation is found in the June and September quarters of 2009 as markets rebounded off the Global Financial Crisis lows. But what explains the elevated observations over the second half of 2020 and start of 2021. There haven’t been that many major exploration discoveries or biotech breakthroughs! Consistent with the narrative around increased retail trading activity, we see both volume and price implications. But can we get more granular? Are there pockets of the microcap sector that are getting more than their fair share of the retail action?
Go small to go big.
Sir John Templeton, one of the world’s greatest investors, on hearing of the outbreak of World War 2 instructed his broker to purchase every stock on the New York Stock Exchange trading at less than $1. The so-called penny dreadfuls! It turns out the strategy was very successful, Templeton invested $10k in 104 stocks that were worth approximately $40k four years later.
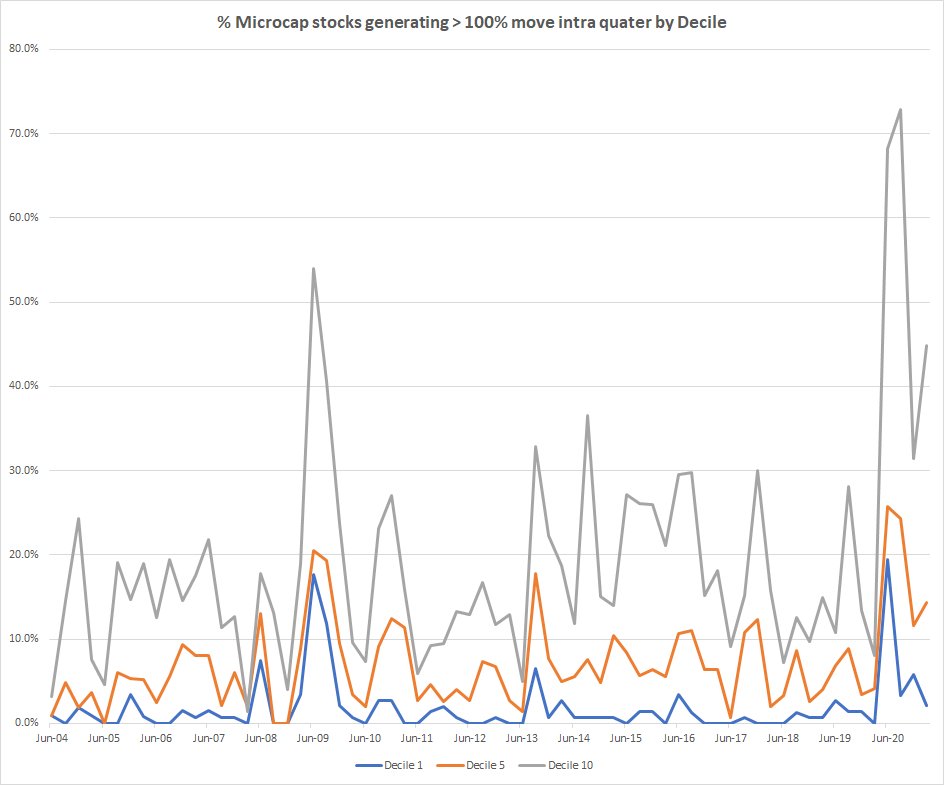
History may not repeat but it often rhymes. The smallest stocks in the microcap sector, the nanocaps, have seen an explosion in price and volume activity since the start of the pandemic. The two charts below break the microcap universe into deciles – 10 equal buckets of stocks sorted by size. For example if there are 1500 stocks in the microcap universe, each bucket will have 150 stocks, with the 1st decile holding the largest 150 stocks and the 10th decile holding the smallest 150 microcap stocks. Both charts clearly show while there has been an increase in activity across the entire universe, it is the bottom 10% that has gone wild in speculative bliss. Note the second chart that tracks the % of companies in each decile that experienced a 100% plus move within the quarter – in the September quarter 72% of the smallest companies were up over 100%. Specifically, that means of the 129 smallest stocks on the ASX in the September quarter, 94 of them were up over 100% at some point during the quarter. Even in the December quarter a speculator had a 1 in 3 chance of picking a stock that experienced a 100%+ price move if they just focused on the nanocaps. Wild!
Figure #4: Microcap stocks turning over at least 100% within the quarter by decile
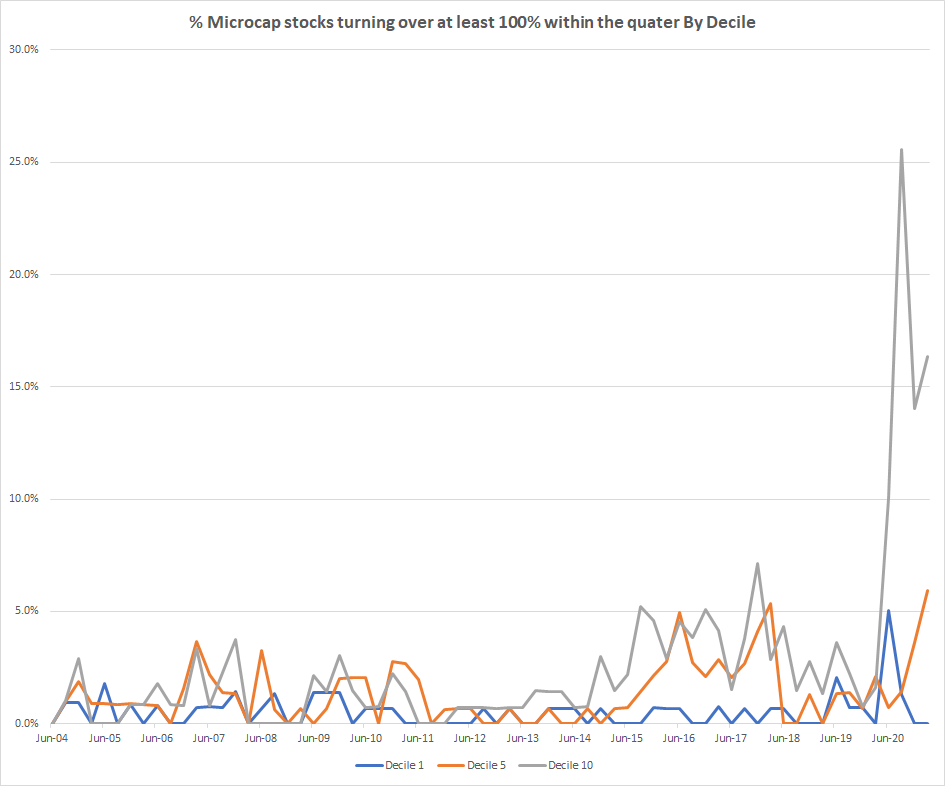
Figure #5: Microcap stocks generating > 100% move intra quarter by decile
What do we make of it?
We do see bullish market conditions as fundamentally justified as massive fiscal and monetary support is met with effective vaccination programs. Also observed are pockets of euphoric speculative appetite that historically have not been sustained. Current market conditions inevitably will change, but unfortunately, we do not have a reliable crystal ball to know when. We remain very optimistic and enthusiastic about finding attractive microcap opportunities to invest in, but we must do so by sticking to our investment process and not getting wowed by spurious hype. This undoubtedly sees us sitting out of the euphoric speculative plays, which in the short term can be frustrating but not worth expending mental or emotional energy on. In the long term we know our process will continue to deliver excellent investment returns for our clients. Back to Sir John Templeton, who attributed much of his success to his ability to “maintain an elevated mood, avoid anxiety and stay disciplined”. Great wisdom indeed.
[1] Link to full report is here https://download.asic.gov.au/media/5584799/retail-investor-trading-during-covid-19-volatility-published-6-may-2020.pdf
[2] For the purposes of this report the microcap sector is defined as those companies outside the largest 250 on the ASX. The Acorn Capital / SIRCA Microcap Index has tracked the returns of the Australian microcap sector since 1974.